

Recently, goormIDE revised its pricing policy. The previous subscription model, which required payment for unused specifications and resources, has been replaced with a pay-as-you-go plan, charging users only for what they use. This change necessitated minute-by-minute monitoring of all container usage.
Consequently, the monitoring app logic needed to execute in under one minute, prompting us to begin performance optimization. This article documents our successful process of reducing the monitoring logic execution time from a lengthy 30 minutes to just seconds.
written Lia, Wynter
edit by Snow
| ☁️ What is goormIDE? goormIDE is a cloud-based development environment (CDE) provided by Goorm. It leverages container technology to offer a flexible and accessible development platform, enabling users to develop programs via web browsers on various devices, anytime and anywhere. |
First, we needed to identify the specific logic within the monitoring app that was causing the delays. To diagnose the issue, we segmented the logic and measured the execution time for each part.
To measure the time taken by specific sections of the Node.js app, I used console.time() and console.timeEnd(). This process involves starting the timer by calling console.time() with an appropriate label at the beginning of the task, and then stopping the timer at the end of the task with console.timeEnd() using the same label. The elapsed time is then outputted, allowing us to pinpoint the slow segments accurately.
console.time("ALogic");
await doAFunc();
console.timeEnd("ALogic");

// Result
// ALogic: 1:23.986 (m:ss.mmm)
1. DB indexing
const container_information = [
{ name: 'containerA', user: 'wynter' },
{ name: 'containerB', user: 'lia' },
{ name: 'containerC', user: 'snow' }
];
Let’s assume we have an array containing container information. To retrieve details about a specific container from this array, we must iterate through each entry and query the database. Without any additional processing, querying a single container took approximately 0.54 seconds. Querying all containers took 22 minutes. Given that additional logic needed to be incorporated, the 22-minute database query time necessitated immediate optimization.
Execution Time: 547.969msDatabases utilize a concept known as indexing. An index is a data structure that enhances the speed of searches within database tables. Indexes can be created using one or multiple columns in a table. They not only facilitate quick data retrieval but also improve sorting and access efficiency.
While indexing may appear beneficial, indiscriminate use on tables with frequent insertions, modifications, and deletions can lead to performance degradation. Therefore, it is crucial to use indexing judiciously.
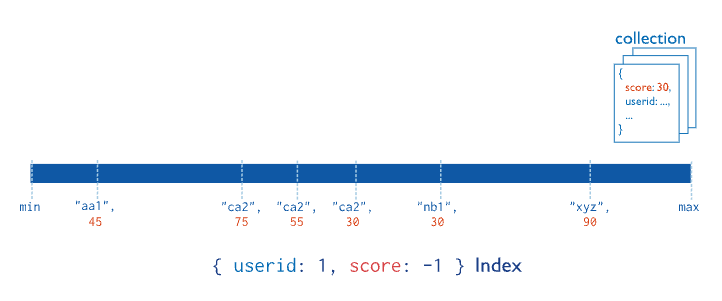
According to MongoDB’s official documentation, an index is a pre-sorted order of data. For instance, if the index is defined as `{ userid: 1, score: -1 }`, the `userid` field is sorted in ascending order, while the `score` field is sorted in descending order.
The official documentation emphasizes the importance of considering field order, sort order, and other factors when using a composite index. Differences in field order or sorting direction will result in different sorting outcomes.
By adding an index to the container information collection, we were able to sort the data in the desired order, significantly improving the search speed. This optimization reduced the time required for a single container query from approximately 0.54 seconds to about 0.2 seconds.
Execution Time: 200.283ms2. Parallelization
ESLint includes a rule called `no-await-in-loop`. In our rush to develop quickly, we made the significant mistake of disabling linting rules, thinking, “Let’s complete the features first and address the rest later.” Ignoring these rules proved costly. Even after reducing the container information database query time to 0.2 seconds, the overall logic execution still exceeded 2 minutes.
The `no-await-in-loop` rule is prominently listed in ESLint’s official documentation as a way to disallow the use of `await` inside loops. This rule ensures that subsequent tasks are not delayed until the previous ones are completed, thereby improving performance.
Adhering to this straightforward yet crucial rule for performance can be implemented as follows.
// first way
for(let i=0; i<container_information.length; i++) {
	await containerService.doSomething(컨테이너_정보[i].name);
	await userService.doSomething(컨테이너_정보[i].user);
}

// second way
const results = [];
const handleContainer = async (container_information) => {
	await containerService.doSomething(container_information.name);
	await userService.doSomething(컨테이너_정보.user);
}
for(let i=0; i<container_information.length; i++) {
	results.push(handleContainer(container_information[i]);
}
await Promise.all(results);
In the first approach, each asynchronous operation is executed sequentially, meaning the second call does not start until the first `doSomething` call completes. This can lead to longer overall execution times.
In contrast, the second approach invokes the `handleContainer` function for each element and adds the resulting Promise to the `results` array. Using `Promise.all`, all `handleContainer` calls are executed in parallel, reducing overall execution time by starting all asynchronous operations simultaneously.
However, caution is needed when using this approach if the results of one iteration are dependent on another, if you need to retry a failed asynchronous operation, or if too many requests are sent in parallel.
I re-enabled the Lint rule, modified the function accordingly, and measured the logic execution time.
---- before ----
Execution Time: 2:41.013 (m:ss.mmm)

---- after ----
Execution Time: 28.454s
The time was reduced by over fivefold, from 2 minutes 41 seconds to a mere 28 seconds. This significant enhancement serves as a poignant reminder of the profound impact that diligent code organization and adherence to fundamental principles can have on performance. It was a realization that dawned upon me swiftly.
3. JSON.stringify
As we were working on enhancing performance, my colleagues suggested alternative Node.js libraries, expressing concerns over the efficiency of JSON.stringify. Without hesitation, I promptly integrated typia and fast-json-stringify. The fast-json-stringify library excels in generating rapid JSON strings through schema-based optimization, proving particularly beneficial for serializing substantial volumes of data.
Before applying the library ----
로직1: 20.939ms
로직2: 769.971ms

After applying the library ----
로직1: 52.927ms
로직2: 779.874ms
Despite our initial anticipation, based on numerous benchmark results, that this library would exhibit superior speed, our internal testing revealed a slight decrease in performance upon its implementation. Consequently, we opted not to proceed with its integration.
4. redis scan
I integrated Redis, an open-source software technology, as an external storage solution to facilitate data synchronization across each Node.js application. However, as the volume of data expanded, the efficiency of Redis’ input/output process began to degrade significantly. Tasks that were previously completed in around 1 second now required 40 seconds.
We encountered significant performance degradation in our Node.js application as the volume of data increased, particularly during the process of synchronizing information for each app with an external Redis store. What used to take approximately 1 second now takes around 40 seconds, severely impacting our operations.
let cursor = '0';
do {
	const [nextCursor, matchedKeys] = await node.scan(
		cursor,
		'MATCH',
		pattern,
	);
	cursor = nextCursor;
	keys = keys.concat(matchedKeys);
} while (cursor !== '0');
The issue did not stem from overlooking precautions, as all necessary measures were diligently followed. Monitoring both the Node.js application and Redis revealed no signs of logic execution overload. Additionally, parallel processing was effectively implemented.
Ultimately, I replicated the same logic directly using redis-cli. The outcome mirrored the Official Document Results Results.
redis 127.0.0.1:6379> scan 0
1) "17"
2)  1) "key:12"
    2) "key:8"
    3) "key:4"
    4) "key:14"
    5) "key:16"
    6) "key:17"
    7) "key:15"
    8) "key:10"
    9) "key:3"
   10) "key:7"
   11) "key:1"
redis 127.0.0.1:6379> scan 17
1) "0"
2) 1) "key:5"
   2) "key:18"
   3) "key:0"
   4) "key:2"
   5) "key:19"
   6) "key:13"
   7) "key:6"
   8) "key:9"
   9) "key:11"
In the second call, scan 17, 17 is the cursor returned by the previous call. Because the result of scan 17 is 0, the server signals to the caller that the collection has been fully explored.
In the official documentation, the data volume was relatively modest, resulting in swift completion of the call within two iterations. However, given our substantial data volume, manual identification proved to be challenging during practical implementation. Consequently, we fine-tuned the scan workload by incorporating the COUNT option to minimize the frequency of calls, although it did not align precisely with the total data count. The COUNT option dictates the number of items returned by the scan command per iteration. Carefully determining this value enables optimization of Redis server performance, with the default set at 10.
let cursor = '0';
do {
	const [nextCursor, matchedKeys] = await node.scan(
		cursor,
		'MATCH',
		pattern,
		'COUNT',
		count
	);
	cursor = nextCursor;
	keys = keys.concat(matchedKeys);
} while (cursor !== '0');
By augmenting the workload using the count option, we managed to streamline the logic execution time back to 1 second.
That’s how we surpassed the 30-minute threshold
There’s a saying that the more urgent the situation, the more important it is to pause and reflect. Upon reflection, many of the challenges encountered could have been avoided had I meticulously studied the official documentation and adhered to fundamental principles. It also highlighted my need for more experience in structural design.
Regardless of how meticulously we plan, there’s always the uncertainty of encountering unforeseen situations. We found ourselves constantly reassessing our strategies and structures, adapting to changing circumstances. Furthermore, certain aspects such as data collection methods, optimal app operations, and response strategies to failures remain areas where we haven’t yet found the perfect solution.
Despite the occasional difficulties and feeling of hitting roadblocks, I’m grateful to my colleagues for their support, enabling me to effectively monitor container usage and refine our pricing policy. I’d like to take this opportunity to express my gratitude to them through this article.
“Thank you!”