

The goormEXP is a gamification-based project management tool that allows teams to plan, share, retrospect, and reward their work. In addition, it offers an education tool that provides highly immersive growth through quests tailored to individual learning goals and preferences.
Currently, goormEXP is using MongoDB (6.x). While the official documentation recommends storing related data as SubDocuments within a single Document to reduce Aggregate operations, some parts of the existing database are modeled to store associated data separately in distinct collections.
This resulted in frequent occurrences of performing lookup operations two or more times when retrieving user/group information. Initially, this did not pose any significant issues to the service. However, the performance issue with these user/group lookup queries began to hinder the service unexpectedly.
written by Rani
edited by Snow
A few days ago in the afternoon, a MongoDB Warning alarm suddenly went off. Due to the increase in requests caused by the store opening, the overall latency for requests was very high. As it was critical for UX, I immediately opened the Atlas1 dashboard and traced the problematic queries. To identify the cause, I first checked various metrics such as execution time and Num Yields2 in Atlas.
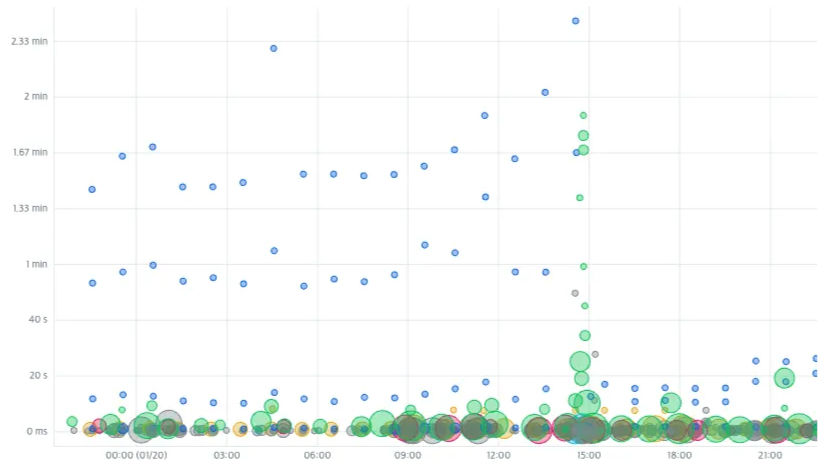
The execution time is skyrocketing into space, piercing through the waiting queue. After wiping away the fleeting tears, the cause has been identified.
The issue occurred in the group/group user collection. In the worst case, the query execution took about 2m (minutes), not 2s (seconds). It wasn’t a typo, but an actual 2 minutes.
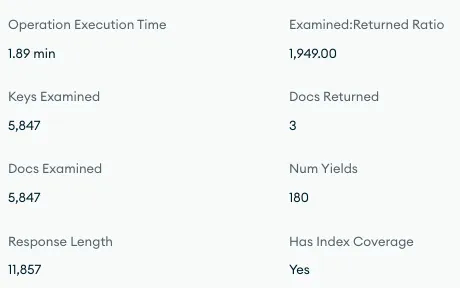
Scanning too many documents for just 3 returns and having an excessively high Num Yields count. It seemed to have fallen into a vicious circle of slowing down, sacrificing resources for other tasks, and becoming slower as execution time increased.
At the time when the issue occurred, upon examining the query with the highest latency, consistently one query stood out at the top.
In Atlas Query Insights, we identified the issue in the server code by examining the $project value of the slow query recorded. The problematic part was loading the list of groups the user has joined along with the list of members within the group and additional user information all at once.

During that time slot, the query was executed 8.46k times, with a total execution time of nearly 7 hours. Since the average time taken was over 2.5 seconds, it was significantly slow. 🥹 Naturally, customer inquiries complaining about the slowness surged.
The culprit is the first nested $lookup
The goormEXP stores information about ‘members,’ which means group members, user information, and organization member information in separate collections.
The query suspected to be the cause of the issue was using nested $lookup to fetch additional information of members, not just member information.
{
  "type": "command",
  "command": {
    "aggregate": "{{Group Collection}}",
    "pipeline": [
      {
        "$match": { // ❶
          "organizationId": "{{organizationID}}"
        }
      },
      {
        "$lookup": { // ❷
          "from": "{{Group Member Collection}}",
          "localField": "id",
          "foreignField": "groupId",
          "pipeline": [
            {
              "$lookup": {
                "from": "{{Organization User Collection}}",
                "localField": "userId",
                "foreignField": "userId",
                "let": {
                  "organizationId": "$organizationId"
                },
                "pipeline": [
                  {
                    "$match": {
                      "$expr": {
                        "$eq": [
                          "$organizationId",
                          "$$organizationId"
                        ]
                      }
                    }
                  }
                ],
                "as": "users"
              }
            },
            {
              "$unwind": "$users"
            },
            {
              "$project": {
                //...Extract only the necessary values
              }
            }
          ],
          "as": "members"
        }
      },
      {
        "$lookup": {
          "from": "{{Group Member Collection}}",
          "localField": "id",
          "foreignField": "groupId",
          "pipeline": [
            {
              "$match": { // ❸
                "$expr": {
                  "$eq": [
                    "$userId",
                    "{{유저ID}}"
                  ]
                }
              }
            },
            {
              "$project": {
                //...Extract only the necessary values
              }
            }
          ],
          "as": "user"
        }
      },
      {
        "$unwind": "$user"
      },
    ],
  },
 //...
}Excluding additional operations such as $project and $unwind, this query performs the following operation.
Query Operation Flow
❶ Filter the group belonging to a specific organization with $match.
❷ Using nested $lookup, retrieve member information belonging to each group and additional user information for each member.
❸ Perform additional $lookup in the ❷ results to filter member information for a specific user.
As a result, when a user is returned as part of a group, the list of group members’ information is returned along with the user information.
Alright, let’s take a look at what the issue is here.
Analyzing in detail with an execution plan
Starting aggregation from a group collection, you cannot directly filter the information of the group to which the user belongs without using lookup.
Therefore, in the query operation flow ❶, all group information belonging to a specific organization is retrieved through the $match operation, and this entire group (result) then transitions to the next step ❷ ($lookup).
Therefore, unnecessary $lookup is performed for members of groups to which the user does not belong. While the query itself is executed quickly due to the index, the issue lies in the significant burden of returning a large number of documents in the subsequent step.
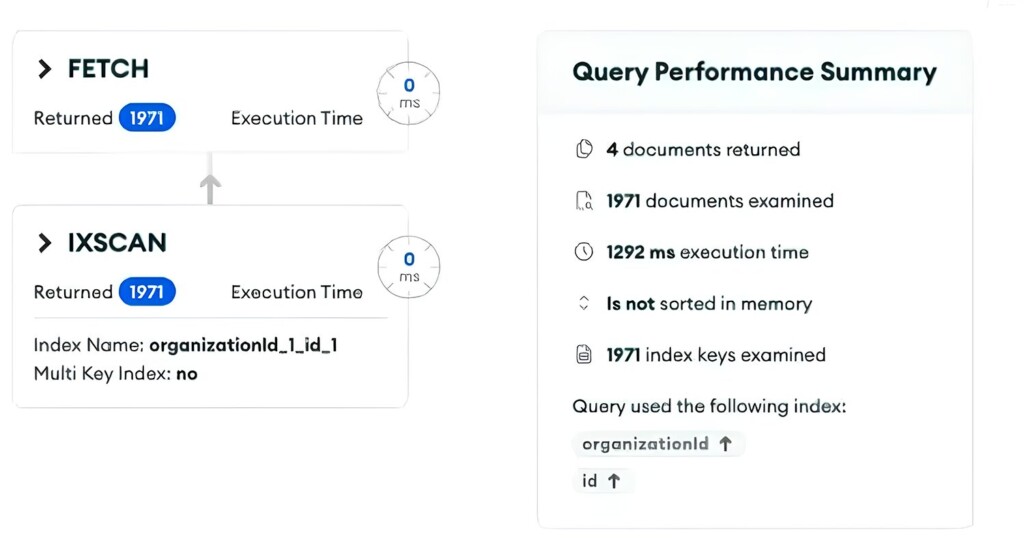
The document returned only 4 results after processing a total of 1971 documents, with an execution time of 1,292ms. Let’s now examine the detailed execution plan.
      {
      "$lookup": {
        "from": "{{Group User Collection}}",
        "as": "members",
        "localField": "id",
        "foreignField": "groupId",
        "let": {},
        "pipeline": [
          {
            "$lookup": {
              "from": "organizationUsers",
              "localField": "userId",
              "foreignField": "userId",
              "let": {
                "organizationId": "$organizationId"
              },
              "pipeline": [
                {
                  "$match": {
                    "$expr": {
                      "$eq": [
                        "$organizationId",
                        "$$organizationId"
                      ]
                    }
                  }
                }
              ],
              "as": "users"
            }
          },
          { "$unwind": "$users" },
          {
            "$project": {
              // ... Extract only the necessary values
            }
          }
        ]
      },
      // Approximately 0.9 seconds were spent in the nested lookup pipeline.
      // As a result of the processing, 1971 documents were aggregated.
      "totalDocsExamined": 5369,
      "totalKeysExamined": 5369,
      "collectionScans": 0,
      "indexesUsed": [
        "groupId_1_userId_1",
        "organizationId_1_userId_1"
      ],
      "nReturned": 1971,
      "executionTimeMillisEstimate": 916
},This is the execution plan for the initial $lookup operation being performed.
❶ In the FETCH stage of Figure 4), results are returned very quickly via an index, but 1,971 documents are returned.
❷ 5,369 documents have been scanned.
The problematic part is the $lookup execution plan ❶. Looking at the executionTimeMillisEstimate, it takes a whopping 916ms in the lookup process. 😱 This is a section that negatively impacts query performance.
The total number of examined documents was 5,369, with 1,971 documents returned (nReturned), indicating that only 37% of the total documents looked up were necessary. By filtering effectively, we can reduce the number of documents included in $lookup to enhance performance. 👍
Now let’s take a look at another $lookup operation following the nested $lookup.
    {
      "$lookup": {
        "from": "{{Group Member Collection}}",
        "as": "user",
        "localField": "id",
        "foreignField": "groupId",
        "let": {},
        "pipeline": [
          {
            "$match": {
              "$expr": {
                "$eq": [
                  "$userId",
                  "{{User ID}}"
                ]
              }
            }
          },
          {
            "$project": {
              // ... Extract the necessary values
            }
          }
        ],
      // In the following unwind stage, group information for users who do not match (i.e., users who are not part of the group) is removed.
        "unwinding": {
          "preserveNullAndEmptyArrays": false
        }
      },
      // Add the requested user's information in the second lookup.
      "totalDocsExamined": 4,
      "totalKeysExamined": 4,
      "collectionScans": 0,
      "indexesUsed": ["groupId_1_userId_1"],
      "nReturned": 4,
      // 1269ms (cumulative time) - 916ms (previous pipeline) = 353ms spent
      "executionTimeMillisEstimate": 1269
},In the 1,971 documents returned earlier, user information is $lookup. In this process, if there is no user matched by $unwind, they will be removed, resulting in only the list of groups to which the user belongs being returned.
In the previous $match stage (query operation flow ❶), after performing $lookup in situations where many items were not filtered out, necessary information is filtered.
The estimated cumulative execution time is 1,269ms, excluding the 916ms spent in the previous pipeline, indicating that 353ms was spent here. As the example user belongs to four groups, the nReturned value is 4.
With additional operations involved, the query execution ultimately took 1,292ms.
Why didn’t we have any issues before? 🤔
The query, which was not originally performing well, suddenly started experiencing performance issues.
With the addition of the ‘Personal Group,’ a significant number of groups were created. The sudden influx of data into the most frequently used collection led to performance issues across the entire service.
Optimizing queries.
Improvement Plan
① To reduce the number of documents transitioning to the $lookup stage during the query execution process, we perform aggregation on the group user collection instead of the group collection.
- In this case, unnecessary documents are filtered out from the beginning based on the userId value.
② Avoid using multiple $lookup operations and split the query when performing aggregate operations.
- In many cases, the previous query is sufficient, so please avoid running subsequent queries in this case.
- By splitting the query and delegating some computational tasks to the application server, you can reduce the burden on a single query and minimize the increase in Num Yield.
In improvement plan ①, since only the minimum documents are left, there is no significant burden even if the task of splitting and mapping queries is delegated to the application server.
After improvement
The [user group retrieval query] that was bundled into one in the aggregate pipeline has been separated from the [group member + additional information retrieval query].
User group query
[
  {
    $match: {
      $expr: {
        // Filter the minimal data using the $match operation before performing the $lookup.
        $and: [
          {
            $eq: [
              "$organizationId",
              "{{organizationID}}"
            ]
          },
          {
            $eq: [
              "$userId",
              "{{유저ID}}"
            ]
          }
        ]
      }
    }
  },
  {
    $project:
      {
        groupId: 1,
        _id: 0
      }
  },
// Since what is actually needed is the list of groups, perform a lookup for the group information.
  {
    $lookup:
      {
        from: "{{Group Collection}}",
        localField: "groupId",
        foreignField: "id",
        as: "group"
      }
  },
  {
    $project:
      {
        group: 1
      }
  },
  {
    $unwind:
      "$group"
  },
// Replace the root with group information instead of group member information
  {
    $replaceRoot:
      {
        newRoot: {
          $mergeObjects: ["$group", "$$ROOT"]
        }
      }
  },
  {
    $project: {
      group: 0
    }
  }
]Upon executing the user group query, the information regarding the list of groups to which the user belongs is returned. To transform the top-level content into group information rather than user group, $replaceRoot is performed.
Performing aggregation on the group user collection and using $replaceRoot is more reasonable than aggregating in the group collection.
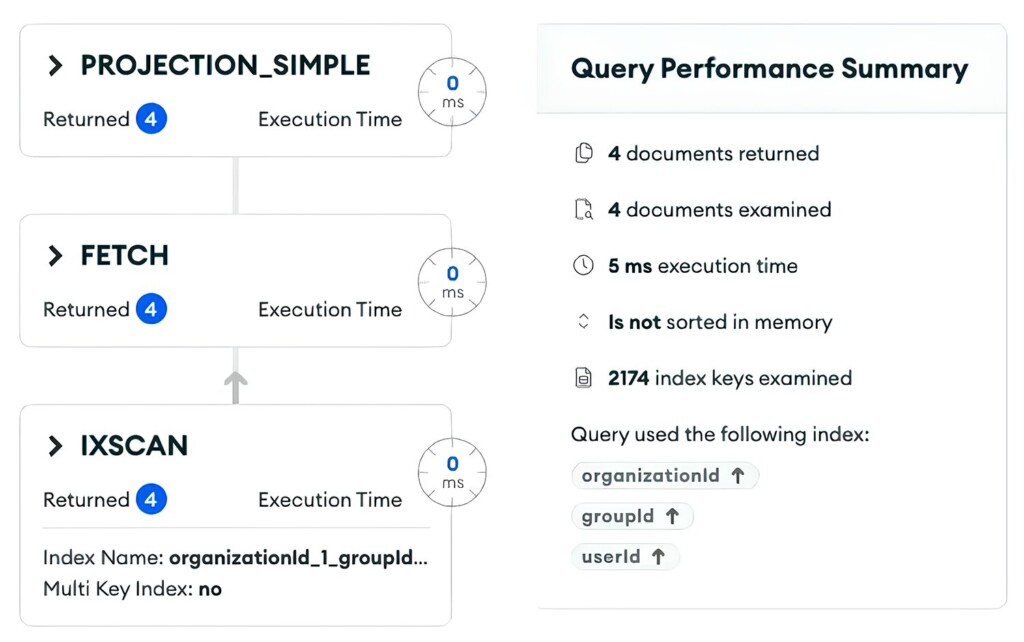
Let’s examine the execution plan of the query for retrieving the user group that has supposedly been changed. The key points to note are as follows.
{
     "nReturned": 4, // Number of documents returned at this stage
      "executionTimeMillisEstimate": 4, // Estimated execution time
      "keysExamined": 2174, // Number of documents examined during index scan

      "keyPattern": {
        "organizationId": 1,
        "groupId": 1,
        "userId": 1
      },
      "indexName": "organizationId_1_groupId_1_userId_1", // Used index
}In the previous query, it took a significant amount of time to retrieve group information for the user, but after changing the aggregate starting point, the query was completed in just 4ms.
There is one more point where performance can be improved. Have you found it?
Additional Improvement: Add a composite index
As you may have noticed from the execution plan’s indexName, this query scans a composite index of organization ID + group ID + user ID. Although 4 documents are returned (nReturned), 2174 documents are scanned through the index (keysExamined).
By filtering with the organization ID + user ID condition, we are unable to ideally utilize the index due to the group ID in the middle of the composite index. Adding the organization ID + user ID composite index to the group member collection can optimize navigation and reduce the search scope.
By adding a compound index, keysExamined will also decrease to 4. Compared to the previous query, not only the execution time but also the overwhelming number of documents scanned and processed have significantly decreased.
As a result, when performing only the fundamental purpose of ‘querying the group to which the user belongs,’ we were able to receive the required information in just 5ms.
Returning information of members belonging to a group.
Let’s examine a query that returns member information within a group. We will use the query written earlier. When comparing the original query with the improved query, the functionality remains the same, but the order is different.
[Before Improvement]
- First,
$lookupall member information. - Filtering only the groups that the user belongs to.
[Improvement]
- Filtering only the groups that the user belongs to.
- Lookup the member information belonging to each group with separate queries.
- Mapping the results of the previous two queries.
First, retrieve the information of the group to which the user belongs, then query the member information in this group using the $in query. As a result, a list of group members is returned.
⚠️ Caution when using$in
In the case of$inqueries, performance degradation may occur as the size of the array increases.
I checked the number of cases in the group with the most members and in the general case to see if there was any issue with the $in query execution. As a result, it was deemed that the resources needed for the operation are minimal, so the $in query was used.
Now, we will write a follow-up query that returns information of the members as follows.
[
  {
    $match: {
      $expr: {
        $and: [
          {
            $eq: [
              "$organizationId",
              "{{organizationID}}"
            ]
          },
          {
            $in: [
              "$groupId",
              [
                ...IDs of the groups returned from the previous query
              ]
            ]
          }
        ]
      }
    }
  },
  {
    $lookup: {
      from: "{{organizationId User Collection}}",
      localField: "userId",
      foreignField: "userId",
      let: {
        organizationId: "$organizationId"
      },
      pipeline: [
        {
          $match: {
            $expr: {
              $eq: [
                "$organizationId",
                "$$organizationId"
              ]
            }
          }
        }
      ],
      as: "userInfo"
    }
  },
  {
    $unwind: "$userInfo"
  },
  {
    $project: {
      // ...Extract only the necessary values
    }
  },
// Grouping based on Group ID
  {
    $group: {
      _id: "$groupId",
      count: {
        $sum: 1
      },
      documents: {
        $push: "$$ROOT"
      }
    }
  },
  {
    $addFields: {
      groupId: "$_id" // Rename _id to groupId
    }
  },
  {
    $project: {
      groupId: "$_id",
      members: "$documents", // Insert a list of members grouped in members
      _id: 0
    }
  }
]The number of tasks within the pipeline has increased, but the cost of operations has decreased. Executing this query will return a list of members grouped by Group ID, as shown in Code 1.
{
  "groupId": {{Group ID}},
  "members": [...Group Member List}}
}Let’s examine the query execution plan.
I will extract and review only the critical parts from the entire query execution plan.
// input stage
{
  "nReturned": 3655,
  "keysExamined": 3655,
  "executionTimeMillisEstimate": 1,
}As seen earlier, we are scanning a large number of documents compared to the total number of returns (nReturned). Since there are no issues with the compound index order, it is suspected that the $in query is the cause.
The scan count has increased, but with the use of appropriate indexes, the execution time is only 1ms. There seems to be no issue with using the $in query.
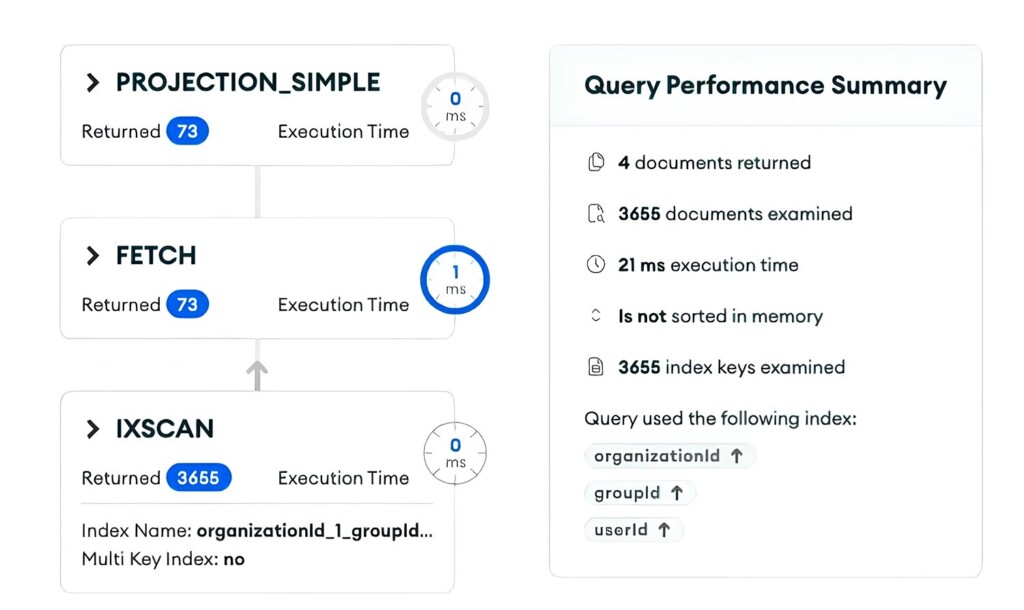
Upon reviewing the entire content outside the input stage, the total execution results, including queries other than $project, are as follows.
        "nReturned": 73,
          "executionTimeMillis": 21,
"totalKeysExamined": 3655,The second query took a total of 21ms. Combining two queries to retrieve the group I belong to and the list of members in each group took approximately 5ms + 21ms.
Now, all we need to do is map the member lists to each group on the server! Since the time complexity of this operation is not very high, it should not have a significant impact on query execution time. Even if we estimate it to be around 30ms + @ in total, it seems like a substantial improvement compared to the previous 1,287ms.
Effect of query performance improvement 📈
The query discussed in this article was surprisingly used in multiple places. Upon thorough examination, it was found that there were many instances of looking up unnecessary information while reusing the existing pipeline. 😱
By making it a query, overall performance improvement has been achieved across multiple APIs.
By changing the order of aggregation and splitting the query, we were able to reduce the execution time from 1287ms to approximately 30ms without adding indexes or caching, even in a situation where all members had to be retrieved from the original query.
With this improvement, by separating queries, only the necessary information is obtained.
The performance issues with the problematic collection-related queries were already known internally, but we decided to address them once again due to a sudden increase in latency.
Through performance optimization, we have also gained the following insights.
- The pipeline should not be reused indiscriminately for the same role.
- When changes occur in the planning resulting in the insertion of a large amount of data, let’s verify if it has any impact on the performance of the existing queries!
Customer inquiries temporarily increased, but it provided an opportunity to work on performance improvements that we had long been interested in, sparking thoughts on optimizing queries. 😊
- It is a fully managed cloud database service that simplifies the process of deploying, scaling, and managing MongoDB databases in the cloud. ↩︎
- Yielding resources to other tasks during query execution. A high Num Yields value indicates that the query was paused and resumed multiple times during execution. If the value remains consistently high, optimization is needed. ↩︎